METHODOLOGIES FOR TIME DOMAIN FREQUENCY STABILITY MEASUREMENT AND ANALYSIS
W.J. Riley, Hamilton Technical Services
ABSTRACT
This paper describes the most common methodologies for making time domain frequency stability measurements, and the ways those data may be analyzed to describe the performance of a frequency source.
INTRODUCTION
The overall steps in performing a frequency stability analysis include data collection, preprocessing, analysis and presentation. This process can be fairly ad hoc for research and development activities, where the results are directed toward discovering, understanding and improving performance, or it can be highly structured for routine production where the expectations are well specified, and the measurement and analysis process may be automated to reduce human workload and to provide consistency. In most cases, however, the overall process is directed toward extracting performance parameters of the frequency source under test. This paper makes suggestions for implementing such time domain frequency measurements.
DATA COLLECTION
Stability data must be of the proper type (phase or frequency), sampling interval (tau), resolution, and duration (# samples) to support the analysis required. Phase data is almost always preferable because frequency data can be obtained from it but not vice-versa. There are instances, however, where frequency data is more convenient to gather, observe and analyze. For example, a stability estimate can be made directly from a stripchart record of frequency data, and outliers are more easily identified and removed. The sampling time must be at least as short as the smallest averaging time of interest, and the measurement resolution should be an order-of-magnitude greater than the expected stability. It is often desirable to take data at a shorter measurement interval to allow the largest number of overlapping samples for analysis. The duration of the run should be at least an order-of-magnitude longer than the largest averaging time required, and more data will provide greater confidence in the results.
Three methods are commonly used for making precise time and frequency measurements, as described below:
· Time Interval Counter Method
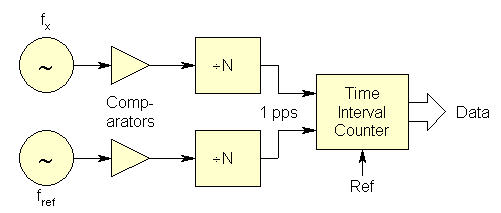
The time interval counter method divides the two sources being compared down to a much lower frequency (typically 1 pps) and measures their time difference with a high resolution time interval counter:

This measurement method is made practical by modern high-resolution interpolating time interval counters that offer 10-digit/second resolution. The resolution is not affected by the division ratio, which sets the minimum measurement time, and determines how long data can be taken before experiencing a phase spillover (which can be hard to remove from a data set). A source having a frequency offset of 1x10⁻⁶ can, for example, be measured for only about 5.8 days before experiencing a 1 pps phase spillover after being initially set at the center.
· Heterodyne Method
The heterodyne method mixes (subtracts) the two sources being compared, and measures the period of the resulting audio-frequency beat note. The measurement resolution is increased by the heterodyne factor (the ratio of the carrier to the beat frequency).
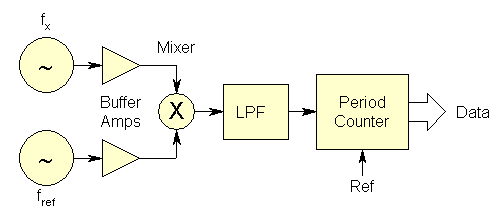
This heterodyne technique is a classic way to obtain high resolution with an ordinary period counter. It is based on the principle that phase information is preserved in a mixing process. For example, mixing a 10 MHz source against a 9.9999 MHz Hz offset reference will produce a 100 Hz beat signal whose period variations are enhanced by a factor of 10 MHz/100 Hz = 105. Thus a period counter with 100 nanosecond resolution (10 MHz clock) can resolve clock phase changes of 1 picosecond. A disadvantage of this approach is that a stable offset reference is required at exactly the right frequency. Even worse, it can only make frequency measurements, requires a priori knowledge of the sense of the frequency difference, and has dead time between measurements.
· Dual Mixer Time Difference
The third method, in effect, combines the best features of the first two, using a time interval counter to measure the relative phase of the beat signals from a pair of mixers driven from a common offset reference:
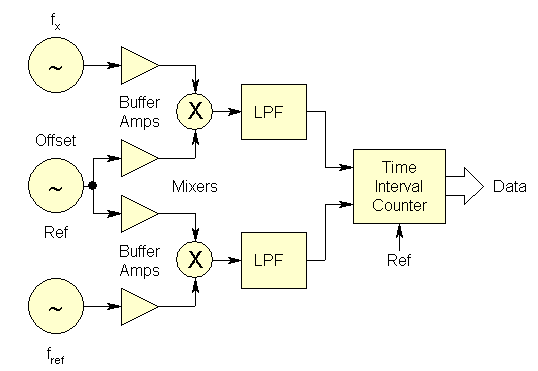
This dual mixer time difference (DMTD) setup is arguably the most precise way of measuring an ensemble of clocks all having the same nominal frequency. When expanded to multiple channels by adding additional buffer amplifiers and mixers, and time tagging the zero-crossings of the beat notes for each channel, this arrangement allows any two of the clocks to be intercompared. The offset reference need not be coherent, nor must it have particularly low noise or high accuracy, because it's effect cancels out in the overall measurement process. For best cancellation, the zero-crossings should be coincident or interpolated to a common epoch. Additional counters can be used to count the whole beatnote cycles to eliminate their ambiguity, or the zero-crossings can simply be time tagged. The measuring system resolution is determined by the time interval counter or timetagging hardware, and the mixer heterodyne factor. For example, if two 5 MHz sources are mixed against a common 5 MHz - 10 Hz offset oscillator (providing a 5x10⁶/10 = 5x10⁵ heterodyne factor), and the beatnote is timetagged with a resolution of 100 nsec (10 MHz clock), the measuring overall system resolution is 10-7/5x105 = 0.2 psec.
Multichannel DTMF clock measuring systems have been utilized by leading national and commercial metrology laboratories for a number of years [1-5]. An early commercial version is described in Reference [3], a newer technique is described in Reference [8], and the Timing Solutions Corporation TS-3020 is an example of such a system [6]. The Stable32 software has capabilities for reading the data files created by a TS-3020 system, allowing clock records to be conveniently processed.
A comparison of the relative advantages and disadvantages of these methods is shown in the following table:
| Comparison of Time and Frequency Measurement Methods | ||
| Method | Advantages | Disadvantages |
| Divider & Time Interval Counter | Provides phase data |
Modest resolution |
| Covers wide range of carrier frequencies | ||
| Easily expandable at low cost | Not suitable for short t | |
| Mixer and Period Counter | Resolution enhanced by heterodyne factor | No phase data |
| Provides direct frequency data | No frequency sense | |
| Usable for short t | Requires offset reference | |
| Expandable at reasonable cost | Single carrier frequency | |
| Dual Mixer Time Difference | High resolution, low noise | Single carrier frequency |
| Provides phase data | ||
| Offset reference noise & inaccuracy cancels | Relatively complex | |
| No fixed reference channel | ||
Other examples of a commercial instruments capable of producing 1-second numeric data with exceptionally low noise and high resolution are the Timing Solutions Corporation Model 5110A Time Interval Analyzer [6] and the Quartzlock Model A7 Frequency & Phase Comparator [7]. Both of those instruments have been used with the Stable32 program to perform state-of-the-art frequency stability measurements.
· Data Quantization
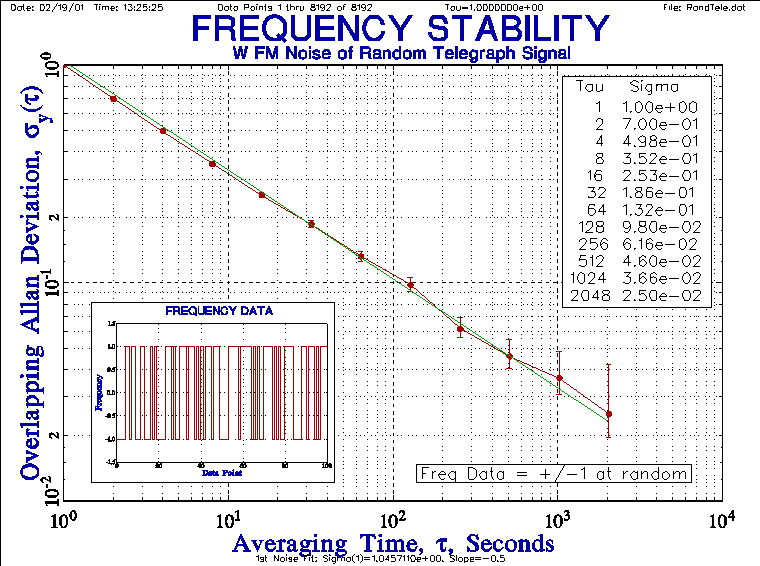
While it is desirable to have sufficient resolution that the data is noise rather than resolution limited, highly quantized data can provide good stability information provided that there is a least 1 bit of meaningful variation, as shown in the following plot for a random telegraph signal representing frequency data having a white FM noise characteristic:
 |
DATA PREPROCESSING
· Outlier Detection
It is not unusual for frequency stability data to contain outliers, especially for large data sets that extend over long measurement runs. Such outliers must be identified, explained, and removed in order to use the rest of the data. The Stable32 program includes robust outlier detection based on median statistics.
· Plotting
Data plotting is an important technique not only for formal analysis, but also as a preprocessing step to become familiar with the data and to plan its analysis. Never underestimate the insight that effective data visualization can provide. An example of the importance of data plotting is a recognition that the results of a measurement are contaminated by some form of environmental sensitivity (see All Tau Analysis below).
· Drift Removal
Frequency drift is present in most frequency sources, and its modeling and removal is an important step both for its own sake in characterizing the drift, and to separate the deterministic drift from the stochastic noise for further analysis. The Stable32 program supports a number of drift models for phase and frequency data.
· Problems and Pitfalls
It can be difficult to distinguish between a bad unit under test and a bad measurement. When problems occur in time-domain frequency stability measurements, they almost always cause results that are worse than expected. It is nearly impossible for a measurement problem to give better than correct results, and there is considerable justification in saying that the best results are the correct ones. Two possible exceptions to this are (1) misinterpretation of the scale factor, and (2) inadvertent coherency (e.g. injection locking of one source to another due to inadequate isolation. Lack of stationarity (changes in the source itself), while not a measurement problem per se, must also be considered. In general, the more devices available and the more measurements being made, the easier it is to sort things out.
One common problem is hum that contaminates the measurements due to ground loops. Because the measurement interval is usually much longer than the period of the power line frequency, and not necessarily coherent with it, aliased "beats" occur in the frequency record. Inspection of the raw data can show this, and the best cure is often isolation transformers in the signal leads. In fact, this is a wise precaution to take in all cases.
All sorts of other mechanisms exist that can interfere with time domain frequency measurements (electrical, electromagnetic, magnetic, thermal, barometric, vibrational, acoustic, etc.). Think about all the environmental sensitivities of the unit under test, and control as many of them as possible. Be alert to day-night and weekly cycles that indicate human interference. Stories abound about correlations between elevators moving and cars coming and going ("auto-correlations") that have affected clock measurements. Think about what can change in the overall test setup. Slow periodic fluctuations will show up more distinctly in an all tau (rather than an octave tau) stability plot.
In high-precision measurements, where picoseconds matter (e.g. 1x10-15 = 1 psec/1000 seconds), it is important to consider the mechanical rigidity of the test setup (e.g. 1 psec = 0.3 mm). This includes the electrical length (phase stability) of the connecting cables. Teflon dielectric is an especially bad choice for temperature stability, while foamed polyethelene is much better. Even a few degrees of temperature variation will cause the phase of a high-stability source to "breathe" as it passes through 100 feet of coaxial cable.
Phase jumps are a problem that should never be ignored. Examination of the raw phase record is critical because a phase jump (frequency impulse) appears strangely in a frequency record as a white FM noise characteristic [10]. Some large phase jumps are related to the carrier period.
DATA ANALYSIS
· Stability Analysis
The most common frequency stability measure is the overlapping Allan (2-sample) deviation, sy(t). That statistic is used to express time domain frequency stability in most cases, and should be used in preference to the classic non-overlapped or "normal" Allan deviation unless there is some particular reason for doing otherwise. The overlapping Allan deviation has the same expected value while providing better confidence. If the frequency source has significant drift, then it is usually removed before performing the stability analysis so that the deterministic and stochastic aspects of the frequency stability can be expressed separately. An alternative is to use the Hadamard (3-sample) deviation which produces the same result as the Allan deviation in the presence of linear frequency drift. Again, the overlapping Hadamard deviation is usually a better choice than its non-overlapping equivalent. If the frequency source is known or suspected to have a highly-divergent (flicker walk or random run FM) noise characteristic, then a Hadamard deviation should definitely be used to provide a meaningful result.
If stability information at the longest possible averaging time is important, then the total versions of the 2-sample (TOTDEV) or 3-sample (HTOT) deviations should be considered. Those statistics offer better confidence at large averaging factors at the expense of longer computation time.
If the data being analyzed exhibits a white or flicker PM noise characteristic, then the modified Allan (MDEV) or modified total MTOT) deviation can be used to resolve the ambiguity between those noise types.
Performing a stability analysis at all possible averaging times (tau) is a form of spectral analysis that can provide important insight into the stability of a frequency source, particularly when the device is subject to some periodic influence such as temperature cycling. The combination of an environmental sensitivity and a cyclic disturbance will cause the time-domain stability to display a distintive pattern of maxima and minima at the half period and period of the stimulus as given by the expression:
where: Df/f = peak frequency deviation, T = period of disturbance, and t = averaging time.
An example of such a stability record is shown below. This is a simulation of the stability of a GPS Block IIR rubidium atomic frequency standard (RAFS) with typical white and flicker noise levels of 2x10-12t-1/2 and 2x10-14 respectively, plus a temperature coefficient of 2x10-13/°C, when exposed to a sinusoidal orbital temperature variation of 5°C p-p with a 12-hour period. The actual clock has a baseplate temperature controller (BTC) that reduces this thermal sensitivity to below the noise level. Even this large periodic variation does not prevent determining the underlying noise level.
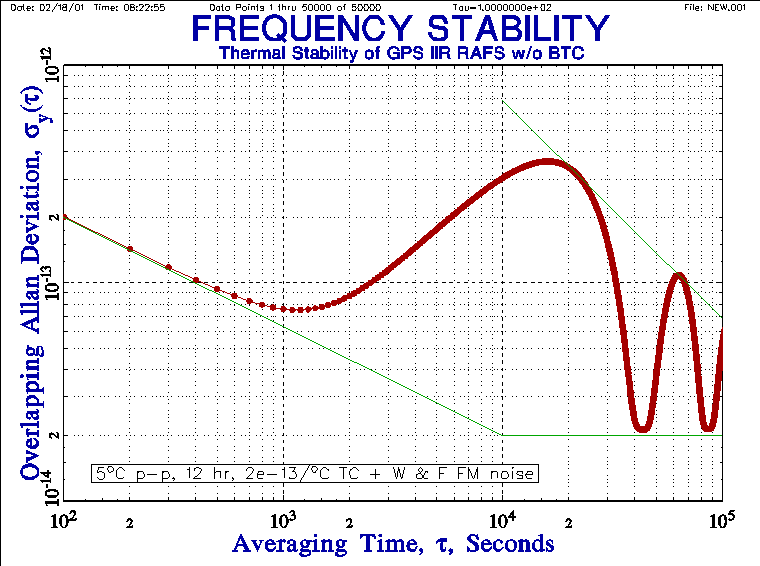 |
This stability plot clearly shows the effect of the periodic disturbance. The worst case occurs at one-half the orbital period (6 hours) where, without the BTC, the RAFS stability is degraded by a factor of ten to 3.2x10⁻¹³, compared with a normal stability of about 3.4x10⁻¹⁴ at that averaging time.
A stability analysis at every possible tau produce a plot with this shape indicate that a periodic effect is disturbing the frequency. In the frequency domain, the Allan variance has a broad peak at Fourier frequency f=1/2t with a bandwidth BW=1/2pt.
DATA PRESENTATION
The results of a stability analysis are usually presented as a combination of textual, tabular and graphic forms. The text describes the device under test, the test setup, and the methodology of the data preprocessing and analysis, and summarizes the results. The latter often includes a table of the stability statistics. Graphical presentation of the data at each stage of the analysis is generally the most important aspect of presenting the results. For example, these are often a series of plots showing the phase and frequency data with an aging fit, phase and frequency residuals with the aging removed, and stability plots with noise fits and error bars. Plot titles, sub-titles, annotations and inserts can be used to clarify and emphasize the data presentation. The results of several stability runs can be combined, possibly along with specification limits, into a single composite plot. The various elements can be combined into a single electronic document for easy printing and transmittal.
VALIDATION
It is important to validate all aspects of the measurement and analysis process. This includes verifying the resolution, scale factor, sense, noise floor, and environmental sensitivity.
Validation of the measurement hardware can be done by (1) making coherent measurements, (2) checking multiple sources and references, (3) comparision against other measurement equipment, and (4) making known phase and frequency changes. The latter can be done by changing cable length, adjusting synthesizer settings, or oscillator tuning voltages.
Validation of the analysis tools is made easier by using commercially-available products. Other validation methods include (1) manual analysis of small data sets, (2) comparison against published results, (3) comparison against other stability analysis programs, (4) comparison against general purpose mathematical and spreadsheet programs, (5) consistency checks for different data types, variances and analysis methods, and (6) checks against simulated clock data.
AUTOMATION
Frequency measurement and analysis systems can benfit significantly from automation. Making their operation automatic provides consistensity, reduces errors, and allows routine processes to be done by lower-skilled personnel. For the measurement hardware, this involves computer control. For the analysis, this may involve writing batch scripts. The Stable32 program includes a built-in scripting capability for automating a frequency stability analysis.
REFERENCES
Rev. 9/23/02